Data Transfer Time Calculator: How to Estimate File Transfer Speed
Published on June 3, 2026 · Niwo
- What is Data Transfer Time?
- The Data Transfer Formula
- Bits vs. Bytes: The Most Common Mistake
- Accounting for Overhead
- Common Transfer Scenarios
- Technology Speed Reference Table
- Real vs. Theoretical Speed
- 1. Protocol Overhead
- 2. Network Congestion
- 3. Disk I/O Limits
- 4. CPU and Memory
- How to Calculate Transfer Time
- Step-by-step method
- Example 1: 10 GB over 1 Gbps Ethernet
- Example 2: 100 GB over USB 3.0
- Example 3: 1 TB over 10 Gbps with NVMe storage
- Large File Transfer Best Practices
- 1. Compress Before Transferring
- 2. Use Parallel Transfers
- 3. Use Resumable Transfer Protocols
- 4. Time Migrations Strategically
- 5. Check Your BDP
- Frequently Asked Questions
- How long does it take to transfer 1 TB over 1 Gbps?
- What is the difference between MBps and Mbps?
- What is the real transfer speed of USB 3.0?
- How can I speed up file transfers?
- What factors affect transfer speed the most?
- Conclusion
- Ready to calculate?
What is Data Transfer Time?
Data transfer time is the amount of time required to move a given amount of data from one location to another over a network or data link. Whether you are copying files between drives on the same machine, uploading a backup to the cloud, or migrating a database between data centers, the transfer time determines how long the operation will take.
Estimating transfer time accurately matters for several practical reasons:
- Backup windows: You need to know if a full backup fits within your maintenance window.
- Cloud migrations: Planning a lift-and-shift or data migration requires realistic time estimates to minimize downtime.
- Capacity planning: Understanding throughput limits helps you choose the right connection speed for your needs.
- User experience: A file that takes “30 seconds” versus “30 minutes” changes how users interact with your service.
The core concept is simple: bigger files take longer, faster connections reduce the time. But the real world introduces complications — unit confusion, protocol overhead, and hardware bottlenecks — that make accurate estimation trickier than the formula suggests.
🔢 Use our Transfer Time Calculator to skip the manual math and get instant estimates for any file size and connection speed.
The Data Transfer Formula
At its simplest, data transfer time is:
Time = File Size ÷ Transfer SpeedBut the units matter a lot. This is where most estimation errors happen.
Bits vs. Bytes: The Most Common Mistake
Networking equipment and ISPs measure speed in bits per second (bps). File sizes are measured in bytes (B). The relationship is:
- 1 byte = 8 bits
- 1 kilobit (Kb) = 1,000 bits
- 1 kilobyte (KB) = 1,000 bytes (or 1,024 in binary, but we use decimal for bandwidth math)
This 8× factor is the single most common source of transfer time estimation errors. When you see “1 Gbps” internet and think “that’s 1 GB per second,” you are off by a factor of 8. One gigabit per second equals 125 megabytes per second (MB/s), not 1,000.
Here is a quick conversion reference:
| Notation | Full name | Value in bits | Value in bytes |
|---|---|---|---|
| Mbps | Megabits per second | 1,000,000 bps | 125 KB/s |
| Gbps | Gigabits per second | 1,000,000,000 bps | 125 MB/s |
| MB/s | Megabytes per second | 8,000,000 bps | 1,000,000 B/s |
| GB/s | Gigabytes per second | 8,000,000,000 bps | 1,000 MB/s |
Accounting for Overhead
The formula above assumes perfect efficiency — every bit sent is data. In reality, network protocols add headers, acknowledgments, and error correction that consume a portion of the bandwidth.
Typical overhead factors by protocol:
| Protocol | Typical overhead | Effective throughput |
|---|---|---|
| TCP/IP (LAN) | ~5–10% | 90–95% of raw speed |
| TCP/IP (WAN) | ~10–20% | 80–90% of raw speed |
| TCP/IP (satellite) | ~20–30% | 70–80% of raw speed |
| UDP (streaming) | ~1–3% | 97–99% of raw speed |
| Encrypted tunnel (VPN) | ~10–25% | 75–90% of raw speed |
| FTP/HTTP (with TLS) | ~10–20% | 80–90% of raw speed |
The adjusted formula becomes:
Real Transfer Time = File Size ÷ (Raw Speed × Efficiency Factor)For example, over a 1 Gbps WAN link with 15% overhead:
Effective speed = 1 Gbps × 0.85 = 0.85 Gbps = 850 Mbps ≈ 106.25 MB/sCommon Transfer Scenarios
Different technologies offer vastly different theoretical and real-world speeds. Here is how they compare:
Technology Speed Reference Table
| Technology | Theoretical max | Real-world sustained | Suitable for |
|---|---|---|---|
| USB 2.0 | 480 Mbps (60 MB/s) | 30–40 MB/s | Small files, backups < 50 GB |
| USB 3.0 / 3.1 Gen 1 | 5 Gbps (640 MB/s) | 350–450 MB/s | External SSDs, large media files |
| USB 3.2 Gen 2 | 10 Gbps (1,250 MB/s) | 800–1,000 MB/s | High-speed external storage |
| USB4 / Thunderbolt 3 | 40 Gbps (5,000 MB/s) | 2,500–3,000 MB/s | Professional video workflows |
| SATA III (internal) | 6 Gbps (600 MB/s) | 500–560 MB/s | SSDs, HDDs |
| NVMe PCIe 3.0 x4 | 32 Gbps (4,000 MB/s) | 2,800–3,500 MB/s | OS drives, high-performance storage |
| NVMe PCIe 4.0 x4 | 64 Gbps (8,000 MB/s) | 5,000–7,000 MB/s | Content creation, gaming |
| Fast Ethernet (100BASE-TX) | 100 Mbps | 85–95 Mbps | Legacy devices |
| Gigabit Ethernet (1000BASE-T) | 1,000 Mbps | 900–950 Mbps | Standard office networks |
| 2.5G Ethernet | 2,500 Mbps | 2,200–2,400 Mbps | Wi-Fi 6 access points |
| 10G Ethernet | 10,000 Mbps | 9,000–9,500 Mbps | Data centers, high-performance workstations |
| Wi-Fi 5 (802.11ac) | 1,733 Mbps | 200–600 Mbps | Home networks |
| Wi-Fi 6 (802.11ax) | 9,608 Mbps | 500–1,500 Mbps | Modern homes, offices |
| Wi-Fi 6E | 9,608 Mbps | 800–2,000 Mbps | Congested areas, 6 GHz band |
| 4G LTE (Cat 12) | 600 Mbps | 20–60 Mbps | Mobile hotspots |
| 5G (mmWave) | 10,000 Mbps | 100–1,000 Mbps | Urban mobile, fixed wireless |
📊 This table assumes optimal conditions. Real-world speeds depend on cable quality, interference, distance, device capabilities, and concurrent usage. Use our BDP Calculator to understand how latency and bandwidth interact for TCP connections.
Real vs. Theoretical Speed
Why do you never get the advertised speed? The gap between theoretical and real-world throughput comes from several sources:
1. Protocol Overhead
Every network packet has headers that consume bandwidth. On a TCP/IP Ethernet connection:
- Ethernet frame header: 38 bytes per packet
- IP header: 20 bytes
- TCP header: 20 bytes
- Total overhead per packet: ~78 bytes on a ~1,500 byte MTU = ~5.2% overhead
Add TCP handshakes, acknowledgments, and congestion control, and the total overhead reaches 10–20% depending on latency and packet loss.
2. Network Congestion
Shared bandwidth means your transfer competes with other traffic. On a 1 Gbps office link shared by 50 people, your effective speed during peak hours may be 20 Mbps or less. On the internet, your traffic crosses dozens of routers, each potentially introducing queuing delays and packet loss.
3. Disk I/O Limits
Your storage is often the bottleneck, not the network. Common sustained read/write speeds:
| Storage type | Sequential read | Sequential write |
|---|---|---|
| HDD (7200 RPM) | 160–200 MB/s | 150–180 MB/s |
| SATA SSD | 500–560 MB/s | 450–520 MB/s |
| NVMe PCIe 3.0 | 2,800–3,500 MB/s | 1,500–3,000 MB/s |
| NVMe PCIe 4.0 | 5,000–7,000 MB/s | 4,000–6,000 MB/s |
If your network can deliver 1,250 MB/s (10 Gbps) but your hard drive only writes at 180 MB/s, the transfer completes at 180 MB/s regardless of network speed.
4. CPU and Memory
Encryption (TLS, VPN), compression, and protocol processing consume CPU. On a modern multi-core system this is rarely the bottleneck, but on low-power devices (Raspberry Pi, NAS with weak CPUs) it can limit transfers to 200–400 Mbps even on a gigabit link.
How to Calculate Transfer Time
Follow these steps to estimate any transfer. We will walk through three realistic scenarios.
Step-by-step method
- Determine the file size in bytes (or Gigabytes).
- Find the connection speed in bits per second (Mbps or Gbps).
- Convert speed to bytes per second: divide by 8.
- Apply overhead factor: multiply by 0.85–0.95 (or 0.70–0.80 for satellite/WAN).
- Divide file size by effective speed.
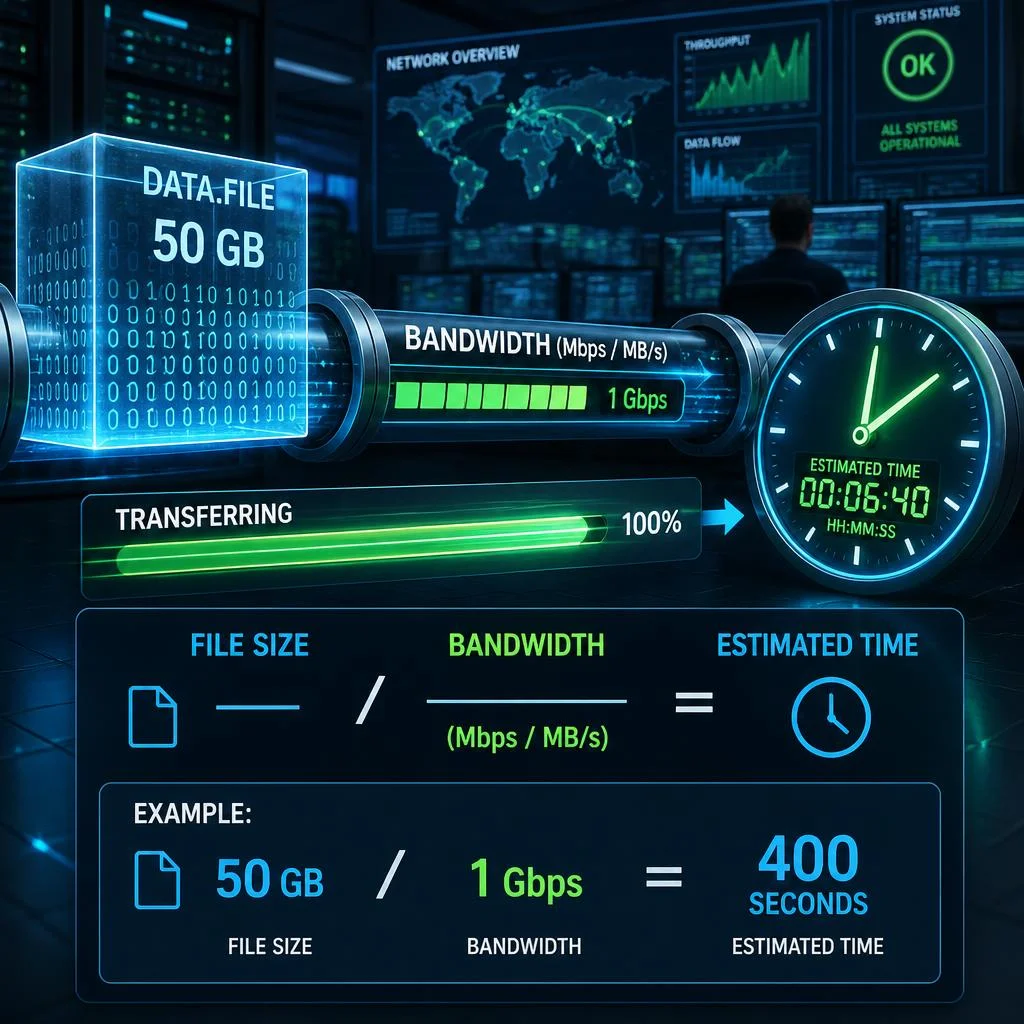
Example 1: 10 GB over 1 Gbps Ethernet
File size:  10 GB = 10,000 MB = 10,000,000,000 bytes
Raw speed:  1 Gbps = 1,000 Mbps
In MB/s:    1,000 ÷ 8 = 125 MB/s
Overhead:   15% → efficiency = 0.85
Effective:  125 × 0.85 = 106.25 MB/s
Time:       10,000 ÷ 106.25 = 94.1 seconds ≈ 1 min 34 sec
Quick check: Even at theoretical max (no overhead), 10 GB over 1 Gbps takes 80 seconds. Include overhead and you are just under two minutes.
Example 2: 100 GB over USB 3.0
File size:  100 GB = 100,000 MB
Raw speed:  5 Gbps = 5,000 Mbps
In MB/s:    5,000 ÷ 8 = 625 MB/s (theoretical)
Real-world: USB 3.0 sustained ≈ 400 MB/s
Time:       100,000 ÷ 400 = 250 seconds ≈ 4 min 10 sec
Quick check: USB 3.0 is much faster than gigabit Ethernet. The same 100 GB file over a 1 Gbps network would take ~15 minutes — 3.5× longer.
Example 3: 1 TB over 10 Gbps with NVMe storage
File size:  1 TB = 1,000,000 MB
Raw speed:  10 Gbps = 10,000 Mbps
In MB/s:    10,000 ÷ 8 = 1,250 MB/s
Overhead:   5% (LAN) → efficiency = 0.95
Effective:  1,250 × 0.95 = 1,187.5 MB/s
Disk limit: NVMe writes at ~3,000 MB/s → network is the bottleneck
Time:       1,000,000 ÷ 1,187.5 = 842 seconds ≈ 14 min 2 sec
Quick check: If the disk were the bottleneck (e.g., HDD at 180 MB/s), the same transfer would take 92 minutes. Always identify the slowest component.
⚡ Instead of doing this math manually, use our Transfer Time Calculator which handles all the conversions and overhead factors automatically.
Large File Transfer Best Practices
When transferring large datasets — databases, VM images, media libraries — follow these principles to minimize time and reduce risk.
1. Compress Before Transferring
Compression can reduce file size by 30–90% depending on data type. Text, logs, and databases compress extremely well. Already-compressed formats (JPEG, MP4, ZIP) do not.
| Data type | Typical compression ratio | 100 GB becomes… |
|---|---|---|
| Database dump (SQL) | 80–95% | 5–20 GB |
| Log files (text) | 90–98% | 2–10 GB |
| VM disk image (QCOW2) | 40–70% | 30–60 GB |
| Media files (MP4, JPEG) | 0–5% | 95–100 GB |
Use parallel compression tools like pigz (gzip), pbzip2, or zstd to leverage multiple cores and avoid serializing the compression step.
2. Use Parallel Transfers
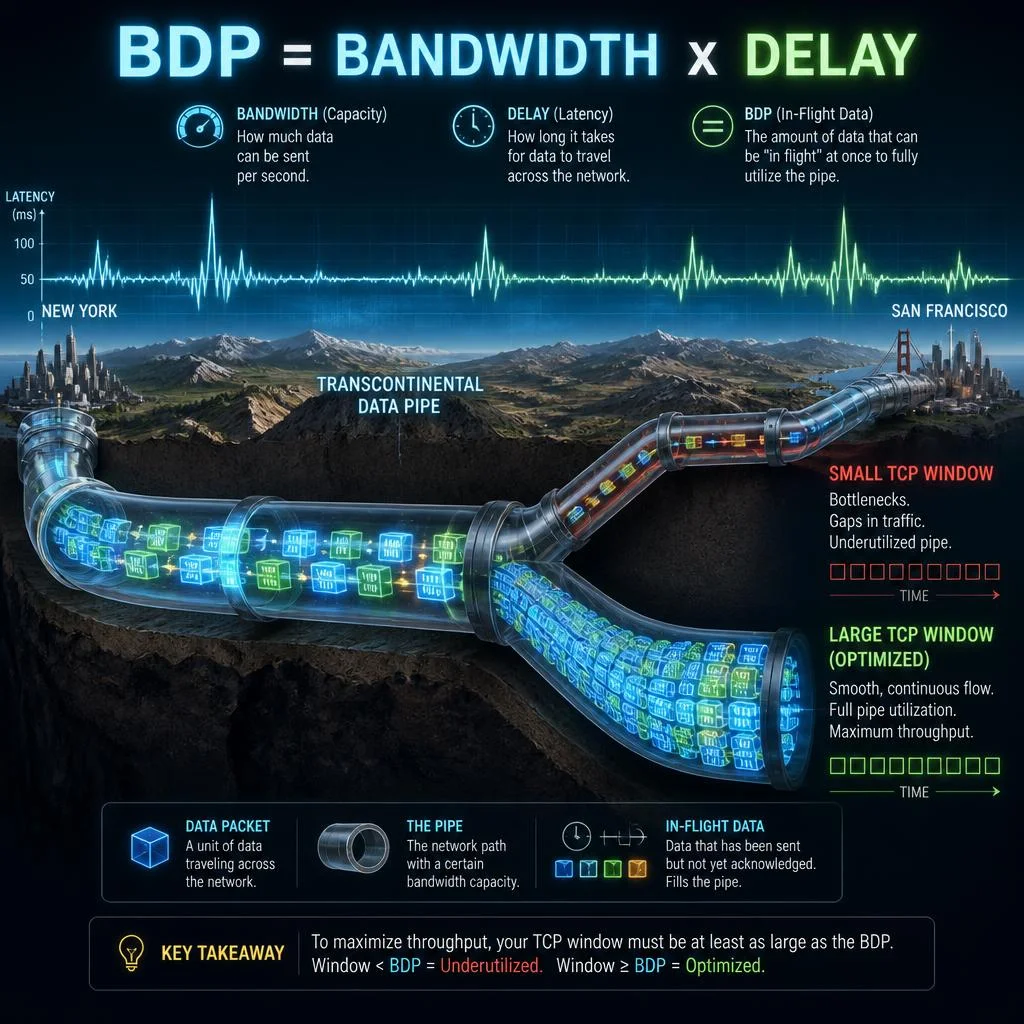
Single-stream TCP is limited by the Bandwidth-Delay Product (BDP). If the window size is too small for the link’s BDP, you waste bandwidth. Parallel streams compensate:
- rsync with
--parallel=N(rsync ≥ 3.2.0) or multiplersyncprocesses - scp replacement:
rsyncorbbcpfor parallel transfer - HTTP: chunked downloads with multiple connections
- S3: multipart uploads (parallel parts)
- iperf3: use
-P Nfor parallel streams when testing
3. Use Resumable Transfer Protocols
For transfers that take hours or days, resumability is essential. A single interruption should not force a restart:
- rsync — resumable by design (transfers only changed blocks)
- curl with
-C -(resume from where it stopped) - lftp — supports auto-resume and mirroring
- rclone — cloud storage sync with resumable chunks
- Bittorrent — surprisingly effective for very large datasets across the internet
4. Time Migrations Strategically
Network congestion follows daily patterns. Schedule large transfers during off-peak hours:
- Best: 2 AM – 6 AM (local time on both ends)
- Good: Weekends and holidays
- Avoid: Monday mornings, end-of-month, Black Friday
Monitor link utilization with tools like nload, iftop, or bmon to identify your window of opportunity.
5. Check Your BDP
Before starting a large WAN transfer, calculate your Bandwidth-Delay Product to ensure TCP is configured optimally:
BDP = Bandwidth × RTTFor a 1 Gbps link with 50 ms RTT: BDP = 6.25 MB. Your TCP receive window must be at least this large to fill the pipe. Use our BDP Calculator to compute the optimal window size and recommended TCP buffer settings.
Frequently Asked Questions
How long does it take to transfer 1 TB over 1 Gbps?
At theoretical maximum speed (1 Gbps = 125 MB/s), 1 TB would take 1,000,000 MB ÷ 125 MB/s = 8,000 seconds ≈ 2 hours 13 minutes. With realistic overhead (15%), the time increases to approximately 2 hours 36 minutes. If the data is on an HDD that reads at 180 MB/s, the disk becomes the bottleneck and the transfer takes ~92 minutes (limited by read speed, not the network). For the most accurate estimate, use our Transfer Time Calculator.
What is the difference between MBps and Mbps?
MBps (megabytes per second) measures file transfer speed as you see it in your operating system. Mbps (megabits per second) is how network equipment and ISPs advertise speed. The conversion is: 1 MB/s = 8 Mbps. A 100 MB/s file transfer equals 800 Mbps of line speed, which requires a gigabit connection (about 80% utilization). This 8× factor is the most common source of confusion when estimating transfer times.
What is the real transfer speed of USB 3.0?
USB 3.0 (now called USB 3.1 Gen 1) has a theoretical maximum of 5 Gbps (640 MB/s). In practice, sustained transfer speeds range from 350 to 450 MB/s depending on the storage device, cable quality, and controller. This makes USB 3.0 approximately 3–4× faster than gigabit Ethernet for local transfers. USB 3.2 Gen 2 (10 Gbps) achieves 800–1,000 MB/s real-world, and USB4/Thunderbolt can reach 2,500–3,000 MB/s.
How can I speed up file transfers?
- Upgrade your bottleneck: Identify the slowest component (network, disk, CPU) and address it first. Upgrading from HDD to NVMe has more impact than upgrading from 1 Gbps to 2.5 Gbps if your disk is the limit.
- Use compression: Enable compression for compressible data types (databases, logs, text files). Tools like
zstdoffer high speed and good ratios. - Increase parallelism: Use rsync with parallel connections or multipart uploads to overcome TCP single-stream limits.
- Optimize TCP: Tune the receive window to match your BDP using our BDP Calculator.
- Reduce overhead: Use UDP-based protocols (UDT, QUIC) when packet loss is high, as TCP’s retransmission logic degrades throughput significantly in lossy environments.
- Eliminate unnecessary hops: Ensure your traffic takes the most direct route. VPNs and proxies add latency and overhead.
What factors affect transfer speed the most?
In order of impact:
- Bandwidth: The raw capacity of the link sets the upper bound.
- Latency (RTT): High latency reduces TCP throughput even with abundant bandwidth (the BDP effect).
- Packet loss: Each lost packet triggers TCP retransmission and window reduction. Even 0.1% loss can halve TCP throughput on high-latency links.
- Disk I/O: Slow storage turns any fast network into a slow transfer (the “HDD tax”).
- Protocol overhead: Encryption, tunneling, and TCP headers consume 10–30% of bandwidth.
- Contention: Shared links (office networks, oversubscribed ISPs) divide available bandwidth among users.
- CPU/memory: Low-power devices struggle to encrypt and process at high speeds.
Conclusion
Estimating data transfer time is a fundamental skill for anyone working with files, networks, or infrastructure. The formula is simple — Time = Size / Speed — but accurate estimation requires understanding:
- The 8× difference between bits and bytes
- Protocol overhead that reduces effective throughput by 10–30%
- Hardware limits (disk, CPU) that can become the real bottleneck
- Network conditions (latency, congestion, packet loss) that affect TCP performance
Whether you are planning a 100 GB database migration, estimating how long a backup will take over a satellite link, or choosing between USB 3.0 and Thunderbolt for your video workflow, the principles in this guide will help you make informed decisions.
Ready to calculate?
- Transfer Time Calculator — Enter any file size and connection speed, and get instant time estimates with overhead adjustments.
- BDP Calculator — Understand how latency and bandwidth interact to affect your TCP throughput. Essential for tuning long-distance transfers.
- Network Tools — Browse all our networking tools for subnet calculators, bandwidth tests, and more.
Know your numbers, plan your transfers, and never guess a migration window again.