System Availability & Downtime: SLA, Metrics, and How to Calculate Uptime
Published on June 3, 2026 · Niwo

- What is System Availability?
- Worked Example
- Availability vs Uptime vs Reliability
- A Practical Analogy
- SLA, SLO, and SLI — The Three Pillars
- SLI (Service Level Indicator)
- SLO (Service Level Objective)
- SLA (Service Level Agreement)
- The SLA → SLO → SLI Pipeline
- Error Budgets: The SRE Innovation
- How to Calculate Availability
- Basic Formula (Single Component)
- Composite Availability (Multi-Component Systems)
- Availability Including Planned Maintenance
- Availability by SLA Level
- MTBF, MTTR, and MTTA Explained
- MTBF (Mean Time Between Failures)
- MTTR (Mean Time to Repair/Recover)
- Breaking Down MTTR
- MTTA (Mean Time to Acknowledge)
- The MTBF / MTTR / Availability Triangle
- The Nines of Availability
- What Each Nine Means
- When You Need Each Level
- The Cost of Nines
- High Availability Strategies
- Redundancy
- Failover Mechanisms
- Load Balancing
- Multi-Region Architecture
- The Three Pillars of HA Operations
- Measuring and Monitoring Availability
- Synthetic Monitoring
- Real-User Monitoring (RUM)
- Prometheus-Based SLI Collection
- Monitoring Stack Recommendations
- Frequently Asked Questions
- What is the difference between availability and reliability?
- How to calculate system availability?
- What is 99.999% availability?
- What does MTTR measure?
- How many nines does AWS have?
- Conclusion
- Key Takeaways
- Put It Into Practice
What is System Availability?
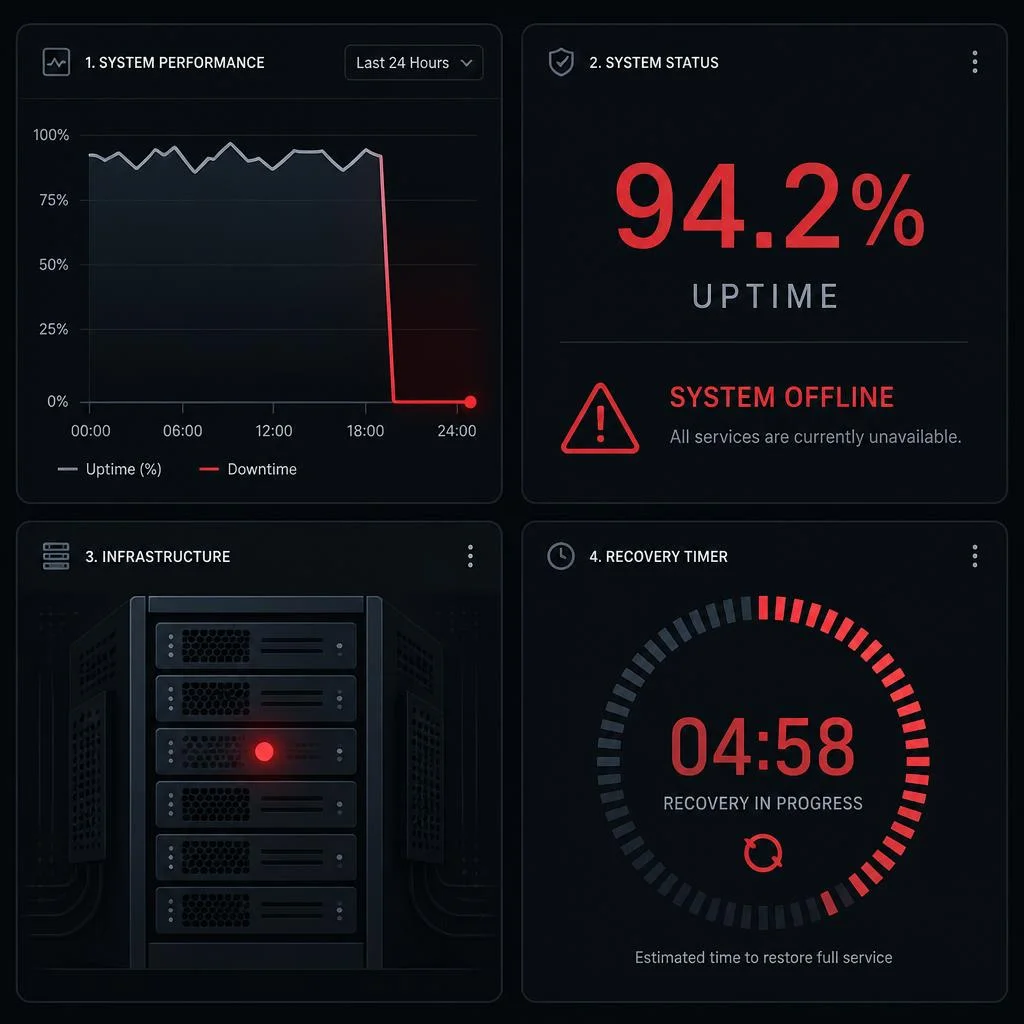
System availability measures the proportion of time a service, application, or infrastructure component remains operational and accessible to its users. It is the single most important reliability metric in IT operations — and the foundation of every Service Level Agreement (SLA).
The formal definition is straightforward:
Availability (%) = Uptime / (Uptime + Downtime) × 100Where:
- Uptime = total time the system was operational during the measurement period
- Downtime = total time the system was unavailable during the measurement period
- The result is expressed as a percentage between 0% and 100%
Worked Example
A web application logs 43 minutes of downtime over a 30-day month:
Availability = (43,200 min − 43 min) / 43,200 min × 100
            = 43,157 / 43,200 × 100
            = 99.90%
That single calculation determines whether you meet your SLA, whether you owe your customers a service credit, and whether your team celebrates or holds a postmortem.
Note: System availability and downtime are two sides of the same equation. You cannot improve one without understanding the other. For a deeper look at what downtime means and what causes it, read our guide: What is Downtime? Definition, Causes & How to Minimize It.
Availability vs Uptime vs Reliability
These three terms are often used interchangeably — but they measure fundamentally different things. Understanding the distinction is critical when negotiating SLAs or designing observability dashboards.
| Concept | Definition | How It’s Measured | Example |
|---|---|---|---|
| Availability | Whether the system is accessible and functional | Percentage of time operational | 99.99% available over a month |
| Uptime | The raw duration a system is running | Time (hours, minutes) | 719 hours of operation in a 30-day month |
| Reliability | The probability that the system performs correctly and without failure over a period | MTBF (hours), error rate, success rate | MTBF of 2,190 hours between failures |
A Practical Analogy
Think of a vending machine:
- Uptime = the machine is powered on
- Availability = you can insert money and select a product (the machine is reachable and responsive)
- Reliability = the machine dispenses the correct product every time, without jamming
A system can have high uptime but low availability (a server that is running but returning 503 errors), or high availability but low reliability (a database that is reachable but returning corrupt data). True operational excellence requires all three.
pie title Common Causes of Downtime
    "Human Error" : 45
    "Power Outages" : 43
    "Hardware Failure" : 25
    "Software Bugs" : 20
    "Cyberattacks" : 15
    "Network Issues" : 12
    "Other" : 10
SLA, SLO, and SLI — The Three Pillars
Site Reliability Engineering (SRE) — the discipline pioneered by Google — defines three distinct layers for managing service quality. Understanding these layers transforms availability from a passive metric into an active engineering tool.
SLI (Service Level Indicator)
An SLI is the raw measurement that tells you whether a service is meeting expectations. Common SLIs include:
- Latency: 95th percentile response time < 200 ms
- Throughput: Requests per second
- Error rate: Percentage of requests returning 5xx status codes
- Availability: Fraction of successful probes or requests
Example: “The proportion of HTTP GET requests to the API that return a 200 OK within 500 ms.”
SLO (Service Level Objective)
An SLO is your target — the threshold your team commits to meeting internally. It is always stricter than your SLA.
Example: “99.95% of API requests will complete successfully in under 500 ms, measured over a rolling 30-day window.”
SLOs give engineering teams a clear, data-driven reliability target. They answer the question: “How reliable does this service need to be?”
SLA (Service Level Agreement)
An SLA is the contractual commitment you make to your customers. It specifies:
- The minimum availability you guarantee (e.g., 99.9%)
- How availability is measured (measurement window, exclusions)
- Penalties if you miss the target (service credits, refunds)
Example: “We guarantee 99.9% monthly uptime. If we fail, you receive a 10% service credit.”
The SLA → SLO → SLI Pipeline
SLI (measurement) → SLO (target) → SLA (contract)A healthy SRE practice sets the SLA lower than the SLO to create a safety buffer. If your SLA is 99.9%, your SLO might be 99.95% — giving you a 0.05% error budget cushion before customers are affected.
Error Budgets: The SRE Innovation
An error budget is the amount of downtime your SLO allows over a rolling window. It converts reliability from an abstract goal into a spendable resource.
Error Budget Formula:
Error Budget = (1 − SLO) × Total TimeWorked Example:
- SLO = 99.95% availability over 30 days
- Total time = 43,200 minutes
- Error budget = (1 − 0.9995) × 43,200 = 0.0005 × 43,200 = 21.6 minutes per month
This means your team can afford 21.6 minutes of downtime per month before violating the SLO. The innovation? You can spend the error budget on risky deployments, feature experiments, or maintenance — as long as you don’t exhaust it. When the budget runs low, you shift focus to reliability work.
🔍 Use our Downtime Calculator to compute exact error budgets for any SLO or SLA level — instantly see how much downtime your targets allow.
How to Calculate Availability
Availability calculation depends on your measurement window and whether you are measuring a single component or a composite system.
Basic Formula (Single Component)
Availability = (Total Time − Downtime) / Total Time × 100Composite Availability (Multi-Component Systems)
When a service depends on multiple components, the overall availability is the product of each component’s availability.
System Availability = A₁ × A₂ × A₃ × ... × AₙWorked Example — A Three-Tier Web Application:
| Component | Individual Availability | Impact on System |
|---|---|---|
| Web server (Nginx) | 99.99% | A₁ = 0.9999 |
| Application server | 99.95% | A₂ = 0.9995 |
| Database (PostgreSQL) | 99.99% | A₃ = 0.9999 |
System Availability = 0.9999 × 0.9995 × 0.9999
                    = 0.9993
                    = 99.93%
Notice that 99.93% is lower than any individual component. This is why distributed systems require each component to be significantly more reliable than the overall target — a principle known as availability budgeting.
Availability Including Planned Maintenance
Some organizations calculate availability excluding planned downtime (maintenance windows). Others include everything. Always check which convention your SLA uses:
- Unadjusted availability: Includes all downtime (planned + unplanned)
- Adjusted availability: Excludes pre-approved maintenance windows
The difference can be substantial. A system with 99.95% unadjusted availability might appear as 99.99% after excluding planned maintenance.
Availability by SLA Level
The table below shows exactly how much downtime each SLA level permits across different time windows:
| Availability Level | Nines | Daily Downtime | Weekly Downtime | Monthly Downtime | Yearly Downtime |
|---|---|---|---|---|---|
| 99% | 1 nine | 14 min 24 s | 1 h 40 min | 7 h 12 min | 3.65 days |
| 99.5% | — | 7 min 12 s | 50 min 24 s | 3 h 36 min | 1.83 days |
| 99.9% | 3 nines | 1 min 26 s | 10 min 4 s | 43 min 28 s | 8.76 hours |
| 99.95% | — | 43 s | 5 min 2 s | 21 min 44 s | 4.38 hours |
| 99.99% | 4 nines | 8.6 s | 1 min 0 s | 4 min 23 s | 52 min 34 s |
| 99.999% | 5 nines | 0.86 s | 6.0 s | 26 s | 5 min 15 s |
| 99.9999% | 6 nines | 0.09 s | 0.6 s | 2.6 s | 31.5 s |
💡 Need to convert between availability percentage and downtime minutes for a specific time window? Our Downtime Calculator handles every SLA level from 99% to 99.9999% — pick any value and see the exact downtime in seconds, minutes, or hours.
MTBF, MTTR, and MTTA Explained
Availability percentages tell you how much downtime occurred, but they don’t tell you why or how well your team responded. That’s where MTBF, MTTR, and MTTA come in.
MTBF (Mean Time Between Failures)
MTBF measures reliability — the average operational time between consecutive failures. Higher MTBF = more reliable system.
MTBF = Total Operating Time / Number of FailuresWorked Example: A load balancer runs for 8,760 hours (1 year) and experiences 6 failures:
MTBF = 8,760 / 6 = 1,460 hours ≈ 60.8 daysThis means the load balancer runs for roughly 60 days on average between failures.
How MTBF relates to availability:
Availability ≈ MTBF / (MTBF + MTTR)If MTBF = 1,460 hours and MTTR = 2 hours:
Availability ≈ 1,460 / (1,460 + 2) = 99.86%MTTR (Mean Time to Repair/Recover)
MTTR measures recoverability — how quickly your team can restore service after a failure. Lower MTTR = faster recovery.
MTTR = Total Downtime / Number of FailuresWorked Example: A database cluster experiences 4 outages totaling 10 hours of downtime:
MTTR = 10 / 4 = 2.5 hoursMTTR is the most actionable metric in this family because it directly reflects the quality of your incident response processes — runbooks, alerting, on-call readiness, and tooling.
Breaking Down MTTR
In practice, MTTR is composed of several sub-phases:
| Phase | Description | Typical Duration |
|---|---|---|
| MTTD (Mean Time to Detect) | Time from failure start to alert firing | 30 s – 15 min |
| MTTA (Mean Time to Acknowledge) | Time from alert to human acknowledgement | 2 – 15 min |
| MTTT (Mean Time to Troubleshoot) | Time spent diagnosing the root cause | 15 – 60 min |
| MTTF (Mean Time to Fix) | Time to implement and verify the fix | 5 – 120 min |
Total MTTR ≈ MTTD + MTTA + MTTT + MTTF
MTTA (Mean Time to Acknowledge)
MTTA measures responsiveness — the gap between an alert firing and a human acknowledging it. It is a lagging indicator for on-call discipline and alert routing quality.
Target ranges:
- Gold: < 2 minutes (critical production systems with 24/7 on-call)
- Silver: < 5 minutes (business-critical services with pager rotation)
- Bronze: < 15 minutes (standard services with email+Slack alerting)
The MTBF / MTTR / Availability Triangle
These three metrics form a closed relationship:
Availability = MTBF / (MTBF + MTTR)| MTBF | MTTR | Availability | Classification |
|---|---|---|---|
| 30 days | 4 hours | 99.44% | Good — typical internal tool |
| 60 days | 2 hours | 99.86% | Great — standard production |
| 90 days | 30 min | 99.98% | Excellent — mission-critical |
| 365 days | 15 min | 99.997% | Elite — AWS/Azure tier |
Key insight: You can achieve the same availability by having an extremely reliable system (high MTBF) OR by recovering extremely fast (low MTTR). The best teams optimize both.
The Nines of Availability
The “nines” shorthand (99.9%, 99.99%, 99.999%) is the standard vocabulary for availability in the industry. Each nine represents a tenfold reduction in allowable downtime.
What Each Nine Means
| Nines Level | The Math | Downtime/Year | Real-World Equivalent |
|---|---|---|---|
| 90% (zero nines) | 1 failure in 10 | 36.5 days | Unacceptable for production |
| 99% (one nine) | 1 failure in 100 | 3.65 days | Dev/staging, internal tools |
| 99.9% (three nines) | 1 failure in 1,000 | 8.76 hours | Standard SaaS, B2B production |
| 99.99% (four nines) | 1 failure in 10,000 | 52.6 min | Enterprise, financial services |
| 99.999% (five nines) | 1 failure in 100,000 | 5.26 min | Telecom, emergency services |
| 99.9999% (six nines) | 1 failure in 1,000,000 | 31.5 s | Carrier-grade, air traffic control |
When You Need Each Level
-
Three nines (99.9%) is the baseline for any production internet service. It means your customers experience about one business day of downtime per year. For most SaaS products, this is acceptable — especially if downtime occurs during off-peak hours.
-
Four nines (99.99%) is the standard for enterprise infrastructure and financial platforms. Under one hour of yearly downtime requires redundant networking, multi-AZ deployments, and automated failover. You cannot achieve this with a single server.
-
Five nines (99.999%) is mission-critical territory. Less than 6 minutes of downtime per year demands active-active multi-region architecture, real-time replication, and a full incident response team on standby 24/7.
-
Six nines (99.9999%) is carrier-grade — think telephone exchanges, 911 dispatch, and satellite communications. It requires fully redundant, geographically distributed infrastructure with zero single points of failure and automated failover measured in milliseconds.
The Cost of Nines
Each additional nine is exponentially more expensive to achieve:
- 99.9% → 99.99%: ~3–5× infrastructure cost increase
- 99.99% → 99.999%: ~5–10× infrastructure cost increase
- 99.999% → 99.9999%: ~10–20× infrastructure cost increase
Rule of thumb: Never pay for more nines than your business requires. A startup with $1M ARR does not need five nines. A payment processor with $1B in daily volume probably does.
High Availability Strategies
High availability (HA) is the engineering discipline of designing systems that remain operational despite component failures. HA is not a single technology — it is a set of patterns applied across the entire stack.
Redundancy
Eliminate single points of failure at every layer:
- Hardware: N+1 power supplies, RAID storage, redundant NICs
- Compute: Multiple application server instances behind a load balancer
- Database: Primary-replica replication with automated failover
- Network: Dual internet uplinks from different ISPs, redundant switches
Failover Mechanisms
| Type | How It Works | Failover Time | Cost |
|---|---|---|---|
| Active-Passive | One server handles traffic; standby replica takes over on failure | 30 s – 5 min | Medium (idle standby resources) |
| Active-Active | Both servers handle traffic simultaneously; loss of one reduces capacity | < 1 s (DNS/LB) | High (full capacity at both sites) |
| Automatic | Health checks detect failure and redirect traffic without human intervention | Seconds | Medium-High (requires orchestration) |
| Manual | On-call engineer triggers failover via runbook | 5 – 30 min | Low (human-dependent) |
Load Balancing
Distribute traffic across multiple healthy instances to prevent any single server from becoming a bottleneck — or a point of failure.
- Layer 4 (TCP/UDP): HAProxy, Nginx Stream, AWS NLB
- Layer 7 (HTTP/HTTPS): Nginx, Traefik, AWS ALB, Cloudflare
- Global: DNS-based (Route53, Cloudflare DNS) with health-checked failover
Multi-Region Architecture
For four nines and above, you need geographic distribution:
- Active-Passive multi-region: Primary region handles all traffic; secondary region is on standby with replicated data. Failover is manual or semi-automated.
- Active-Active multi-region: Both regions handle live traffic simultaneously. Requires global load balancing, data replication with conflict resolution, and careful session management.
The Three Pillars of HA Operations
- Monitoring: Detect failures faster than your users do
- Automation: Eliminate human latency from the recovery path
- Testing: Validate your HA design through chaos engineering and game days
Without all three, your multi-region architecture is just a more expensive way to fail.
Measuring and Monitoring Availability
You cannot improve what you do not measure. Effective availability monitoring requires the right tools and the right approach to SLI collection.
Synthetic Monitoring
Synthetic monitoring simulates user behavior with pre-defined scripts or probes:
- UptimeRobot: Free HTTP/HTTPS monitoring with 5-minute intervals and status pages
- Pingdom: Advanced synthetic checks with multi-step transaction scripts (login → search → checkout)
- Checkly: Developer-friendly, code-first synthetic monitoring with Playwright-based browser checks
- Grafana Synthetic Monitoring: Open-source probes integrated with the Grafana ecosystem
Real-User Monitoring (RUM)
RUM captures actual user interactions to measure availability from the user’s perspective:
- Google Analytics / CrUX: Real-user performance data aggregated by Chrome users
- Datadog RUM: Full-session replay with frontend and backend trace correlation
- New Relic Browser: JavaScript error tracking and page load metrics
Prometheus-Based SLI Collection
In the Kubernetes and cloud-native ecosystem, Prometheus is the standard for SLI instrumentation:
# Service availability over the last 30 days
1 - (
  sum(rate(http_requests_total{status=~"5.."}[30d])) /
  sum(rate(http_requests_total[30d]))
)
This PromQL query calculates the proportion of non-5xx responses over a rolling 30-day window — a direct SLI measurement.
Monitoring Stack Recommendations
| Use Case | Recommended Tools |
|---|---|
| Simple uptime monitoring (1–10 services) | UptimeRobot, Better Uptime |
| Multi-service with alerting | Pingdom, Checkly |
| Cloud-native / Kubernetes | Prometheus + Grafana + Alertmanager |
| Full observability (APM + RUM + logs) | Datadog, New Relic, Grafana Cloud |
🔍 Use our Downtime Calculator alongside your monitoring data — convert your measured downtime minutes into an availability percentage and check it against your SLA targets instantly.
Frequently Asked Questions
What is the difference between availability and reliability?
Availability measures whether a system is accessible (can you reach it?). Reliability measures whether it behaves correctly (are the responses valid?). A system can be 99.99% available but only 95% reliable if it frequently returns errors or corrupt data. Availability is a binary metric (up/down); reliability is a correctness metric (good/bad responses).
How to calculate system availability?
System availability is calculated as (Total Time − Downtime) / Total Time × 100. For composite systems, multiply each component’s availability together. Example: a web app with 99.99% uptime over a 30-day month (43,200 minutes) and 43 minutes of downtime has 99.90% availability. Use our Downtime Calculator for instant conversions.
What is 99.999% availability?
99.999% availability (“five nines”) allows a maximum of 5 minutes and 15 seconds of downtime per year — approximately 26 seconds per month. It is the standard for mission-critical infrastructure like telecom switches, payment rails, and emergency dispatch systems. Achieving five nines requires active-active multi-region architecture with automated failover.
What does MTTR measure?
MTTR (Mean Time to Repair) measures the average time it takes to restore a system after a failure. It includes detection, acknowledgement, diagnosis, and repair. A lower MTTR means faster recovery. MTTR of under 1 hour is considered excellent; under 15 minutes is elite. MTTR is the most impactful metric to optimize because it directly reduces downtime duration.
How many nines does AWS have?
AWS commits to specific availability targets per service in its SLA documentation. Amazon S3 has a 99.99% SLA (four nines). Amazon EC2 has a 99.99% SLA for multi-instance deployments in different Availability Zones. AWS Lambda has a 99.95% SLA. No AWS service guarantees 100% availability, and most offer service credits if they miss their published SLA targets. AWS itself reports aggregate uptime across all services, but actual experience varies by region and service configuration.
Conclusion
System availability is not just a number — it is the language your infrastructure uses to tell you how healthy it is. Understanding how to calculate it, how to break it down into SLIs, SLOs, and SLAs, and how to use error budgets to drive engineering decisions transforms availability from a report card into a competitive advantage.
Key Takeaways
- Availability = Uptime / (Uptime + Downtime) × 100 — Know the formula and when to apply it
- Distinguish between uptime, availability, and reliability — They measure different things, and confusing them leads to bad SLA design
- Set SLOs tighter than SLAs — The gap is your error budget, and it is your most valuable operational resource
- Optimize MTTR before MTBF — Fast recovery is often cheaper and more impactful than preventing every possible failure
- Match your nines to your business — Five nines is a technical achievement; four nines is usually the right business answer
- Measure what matters — Use synthetic monitoring, RUM, and Prometheus-based SLIs to track availability from every angle
Put It Into Practice
Ready to apply what you’ve learned?
- Calculate your current availability — Our Downtime Calculator converts between uptime percentages and downtime minutes for any time window, from daily to yearly
- Review your SLA targets — Are they realistic? Do your SLOs give you enough error budget?
- Read about downtime fundamentals — Our guide What is Downtime? covers definitions, causes, costs, and strategies for minimizing unplanned outages
Start measuring, start improving, and let the numbers guide your reliability journey.